General
Guides
Development
API
Charts
- Bar Chart
- Bar Chart (Discrete)
- Donut Chart
- Scatter Plot
- Simple Time Series
- Singlegraph
- Singlegraph Grid
- Standard Time Series
Text
- Comparison Jumbotron Singlestat
- Comparison Singlestat
- Comparison Summation Table
- Heading
- Jumbotron Singlestat
- Markdown
- Percentage Table
- Singlestat
- Summation Table
- Timer Stat
- Time-Shifted Jumbotron Singlestat
- Time-Shifted Singlestat
- Time-Shifted Summation Table
Layout
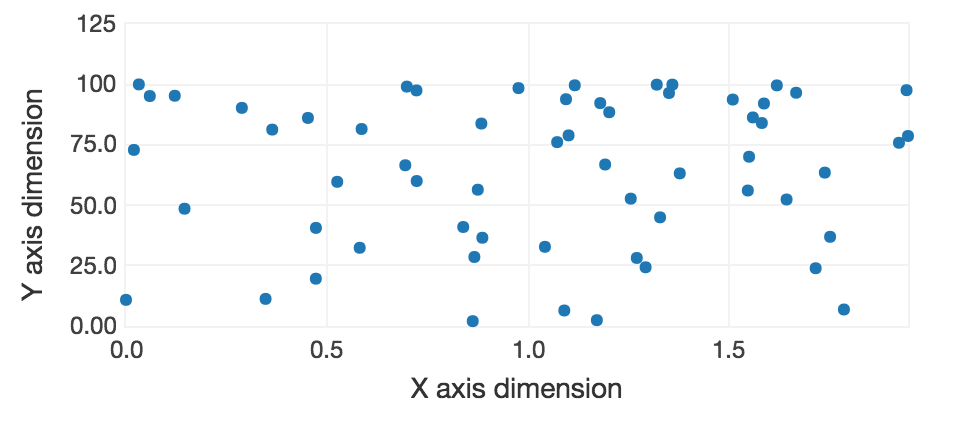
Scatter Plot
A scatter_plot takes plots two data series against each other, one
on the X-axis and one on the Y-axis, to show the correlation between
them.
Attributes
| Attribute | Default Value | |
|---|---|---|
title |
||
query |