General
Guides
Development
API
Charts
- Bar Chart
- Bar Chart (Discrete)
- Donut Chart
- Scatter Plot
- Simple Time Series
- Singlegraph
- Singlegraph Grid
- Standard Time Series
Text
- Comparison Jumbotron Singlestat
- Comparison Singlestat
- Comparison Summation Table
- Heading
- Jumbotron Singlestat
- Markdown
- Percentage Table
- Singlestat
- Summation Table
- Timer Stat
- Time-Shifted Jumbotron Singlestat
- Time-Shifted Singlestat
- Time-Shifted Summation Table
Layout
A Brief Tour of Tessera
The Front Page
There are two sections of the front page that are dynamically populated. Above the three big section icons is a section which can be populated by a small dashboard. If any dashboards are tagged with the tag featured-billboard, one of them will be randomly selected. Obviously, it should be a very compact dashboard. A single graph with span=12, for example - showing the rate of metrics ingress.
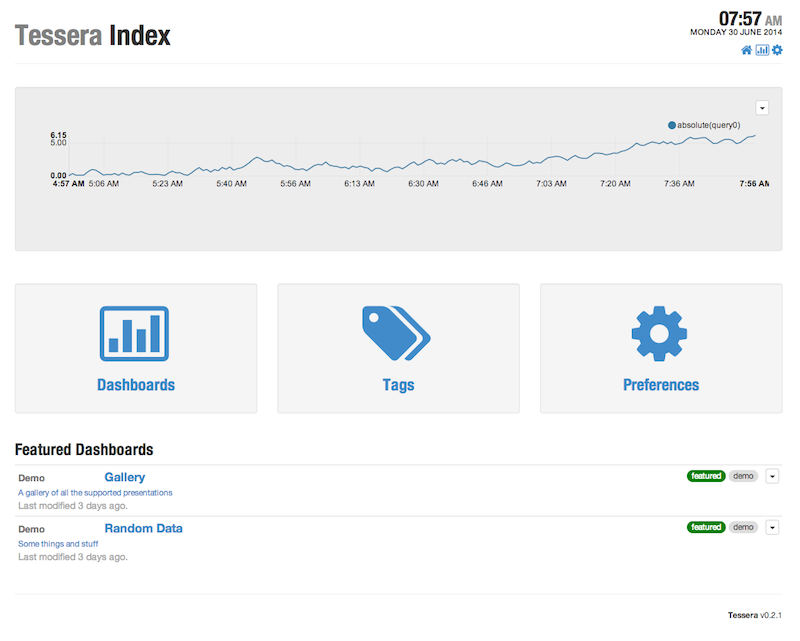
At the bottom, the Featured Dashboards list will be populated by all dashboards tagged with the tag featured.
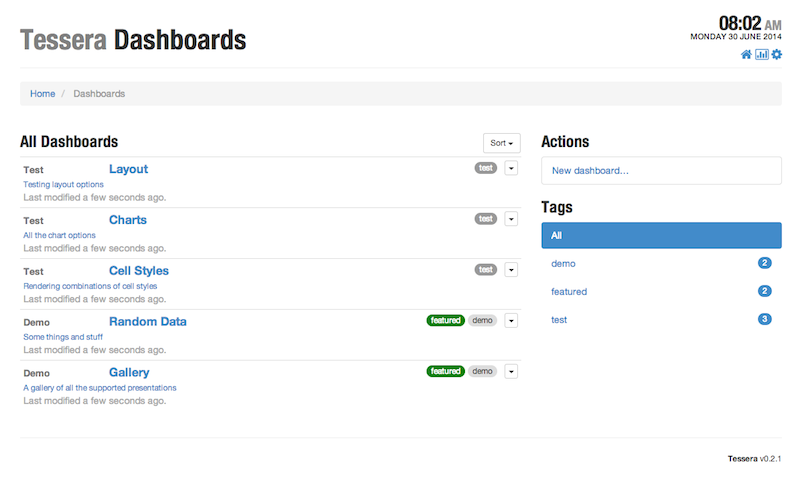
Dashboard List
The dashboard list page, at /dashboards/ lists all dashboards (there is no paging support yet), with a variety of sorting options, allows you to create a new dashboard, and allows filtering by tag.
To list dashboards with a specific tag, click on the tag in the list on the right, or link to /dashboards/tagged/:tagname.
Dashboard Display
Dashboard URLs
Linking to Dashboards
Links to the UI for a dashboard (as opposed to its API representation) take the form;
/dashboard/:id/:slug
The :slug portion is actually irrelevant and ignored - you can put anything in there or omit it entirely for most links. It’s derived from the dashboard’s title, and is just there to make links more readable when pasted somewhere else, like email or a trouble ticket.
Linking to an interface Mode
You can have Tessera switch to a specific interface mode on load by adding mode=<mode> as a URL parameter. For instance, this link will put the UI into display mode immediately.
/dashboard/151/http-traffic?mode=display
You can link directly to editing a dashboard with mode=edit.
Setting display parameters
Anything that can be configured on the preferences page can be overriden (without updating the user preference) by supplying it as a query parameter when loading a dashboard URL. Available query parameters are:
mode
The UI mode to switch to - valid modes are edit, display, and standard (default).
theme
The UI color theme to render - valid themes are light, dark, solarized-light, and solarized-dark.
renderer
Which chart rendering library to use for rendering interactive charts (the only option for static charts is Graphite’s built in PNG support). Valid values are nvd3 and flot.
interactive
Explicitly set whether to render graphs in browser (with interactive=true) using a JavaScript library, or on the Graphite server as static images (interactive=false, which is the default). See renderer.
Linking to a Transform
When you apply a transform to a chart in the UI, the URL in the window location bar will update to indicate that, and the link is usable to load a dashboard directly to that transform.
The general form for a transform link is:
/dashboard/:id/:slug/:itemid/transform/:name
All the usual URL parameters are available, so this example links to a specific element of the gallery dashboard displaying the last 12 hours of data, with the Isolate transform applies, in display mode, with the dark UI color theme.
http://localhost:5000/dashboards/40/gallery/d11/transform/Isolate?from=-12h&mode=display&theme=dark