Release 0.8.0
UPDATE: Release 0.8.1 of Tessera is now available. Release 0.8.0 had a minor dependency problem. Fixing it is the only change in 0.8.1.
Dashboard Enhancements
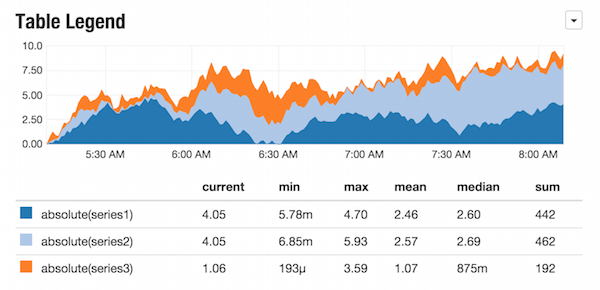
Table Legends
The placeholder table legend type is a placeholder no
more. Selecting table as the legend type for any chart will render a
summation table as the legend.
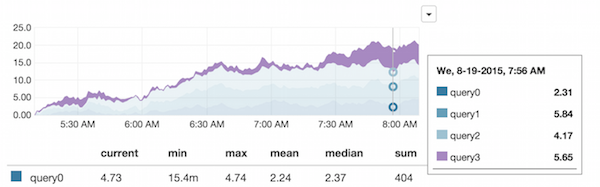
More Interactivity
The interactive renderer now has additional interactive features. For line and area charts with legends, mousing over the legend will now highlight the corresponding series on the chart, as will mousing over the series itself.
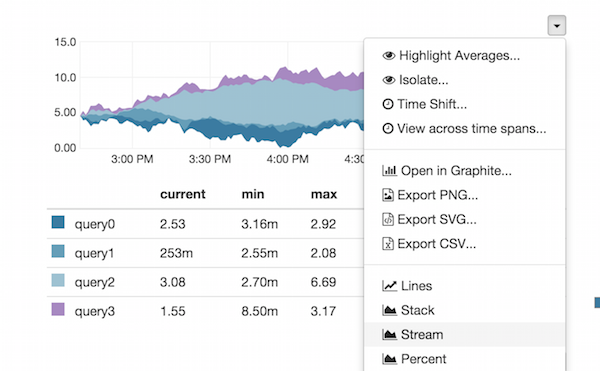
For the stacked area chart type, there are also new actions to
dynamically switch the stack mode to none, stack, stream, or
percent mode.
Logarithmic Y-Axis
The Y-axis of time series charts can now be set to a logarithmic scale.
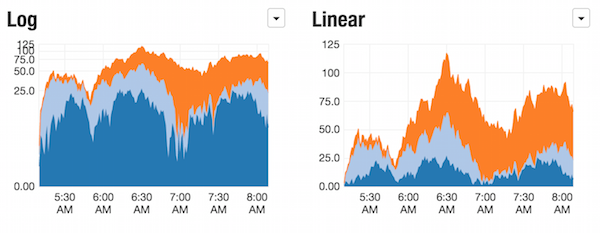
Chart Resizing
The flot resize plugin, jquery.flot.resize.js is now included, so
dynamic charts will automatically redraw if the browser window is
resized, or when resizing cells while editing.
Embedding
There’s a new UI endpoint which renders dashboards with none of the navigation UI chrome (not even the dashboard title) - it’s intended for embedding small dashboards in other sites via the use of iframes.
The new endpoint is /dashboards/<id>/<slug>/embed. I.e. just take an
existing dashboard URL and add /embed to the end of it. It accepts
all the same query parameters as the regular endpoint, so it can be
used with templatized dashboards, you can specify the time range, or
the color theme, etc…
API Enhancements
CORS
The API now supports Cross Origin Resource Sharing, which enables the Tessera API to be called from other browser-based tooling, opening up integration possibilities.
Bug Fixes
- Auto-refresh now reloads static PNG images
- Legends are now rendered consistently between both renderers, which makes the graph sizes consistent between flot and graphite.
See the full list of closed issues.