Feb 2, 2017
Release 0.10
0.10 is another incremental release, tidying up a few things and adding a few minor new features.
A web application for constructing elegant, interactive presentations of data from Graphite.
0.10 is another incremental release, tidying up a few things and adding a few minor new features.
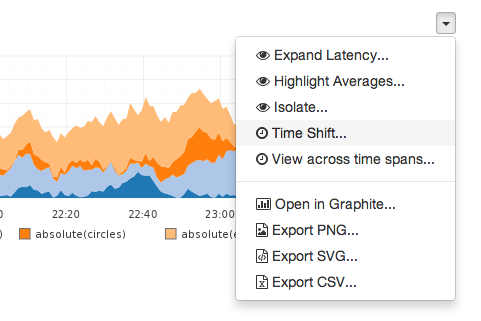
Easily extensible actions and transformations can interactively drill-down into data queries on the fly, or even completely transform them.
# Duplicate a dashboard with curl
curl -G
  $TESSERA/api/dashboard/15
  -d 'definition=true'
|
curl -X POST
  $TESSERA/api/dashboard/
  -H 'Content-Type: application/json'
  -d @-
A REST-ful HTTP API provides access to everything, and allows
easy management with HTTP tools like curl.
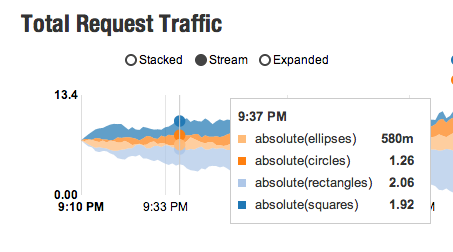
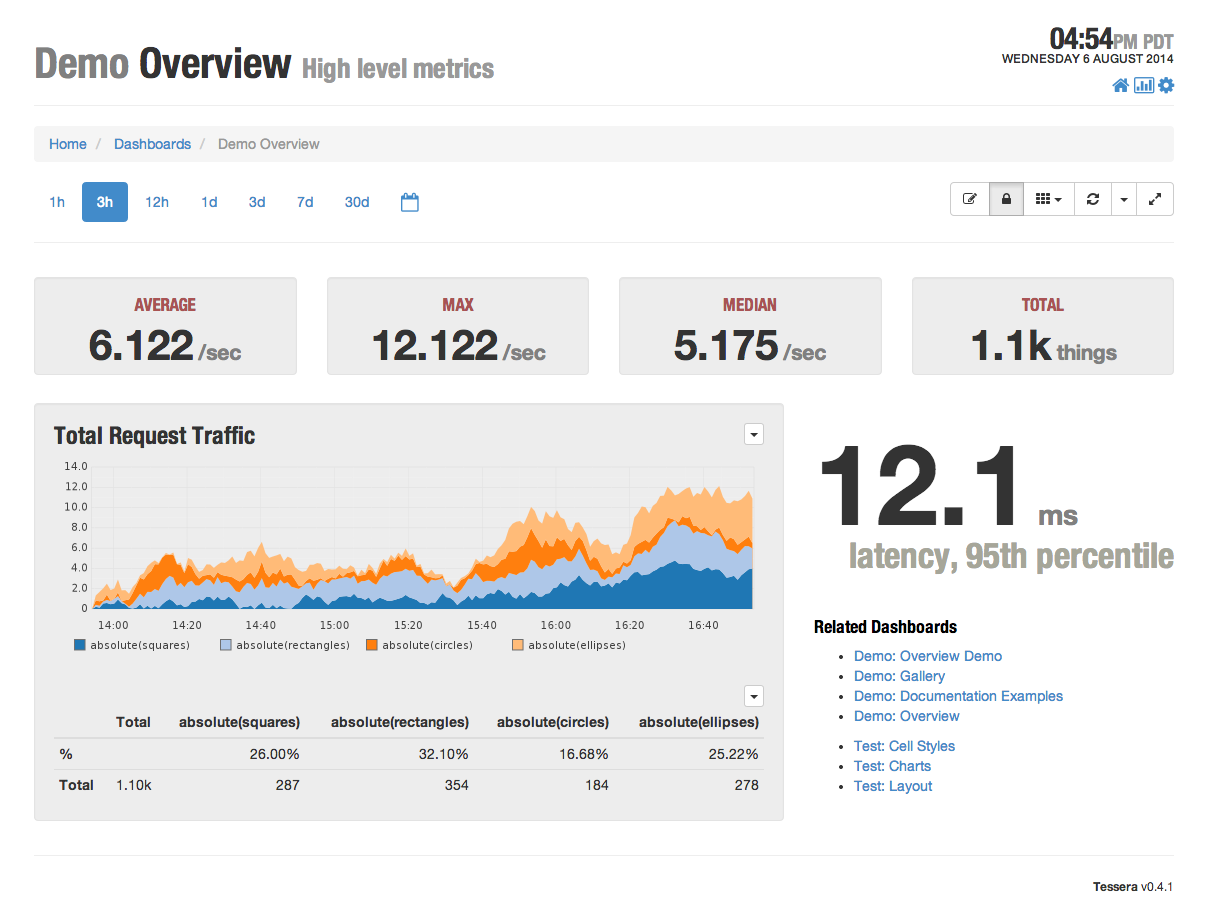
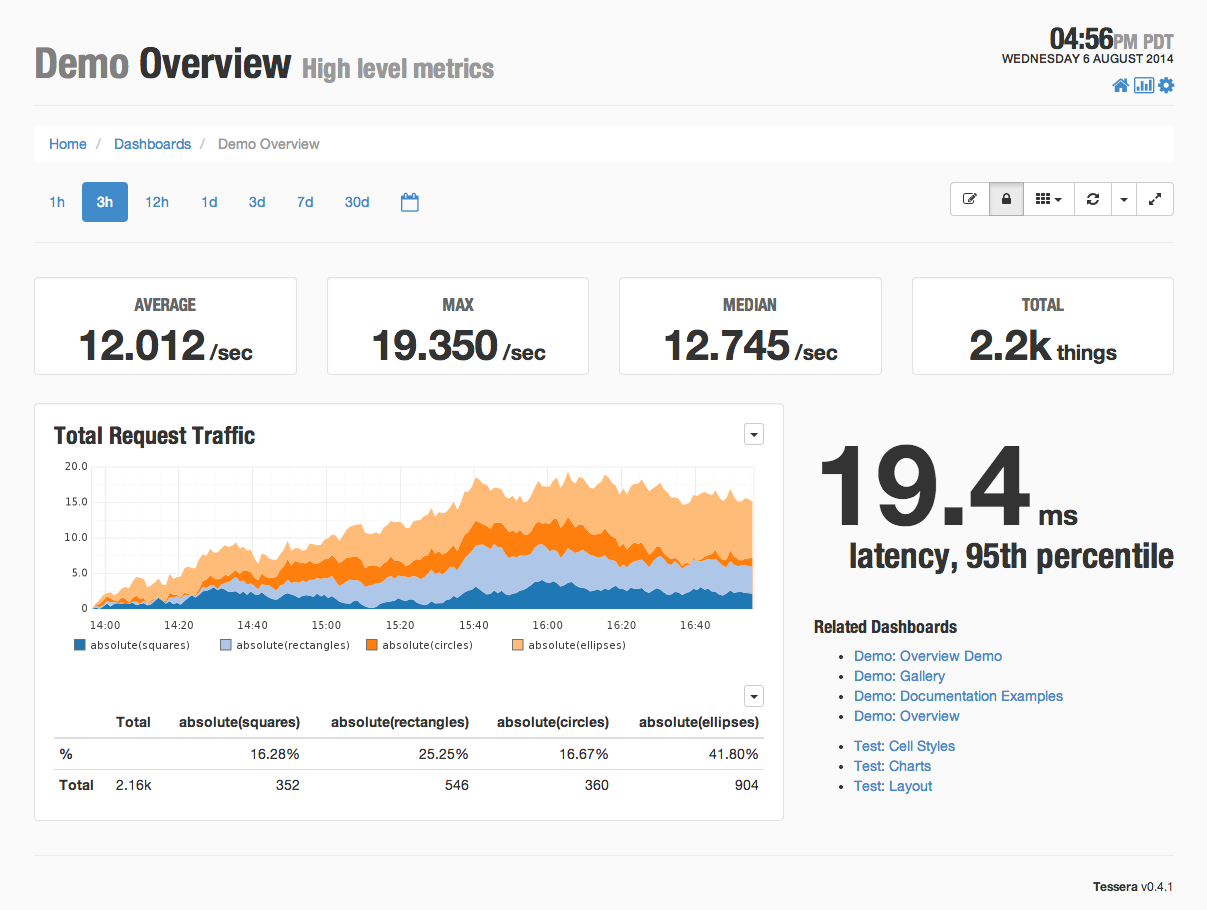
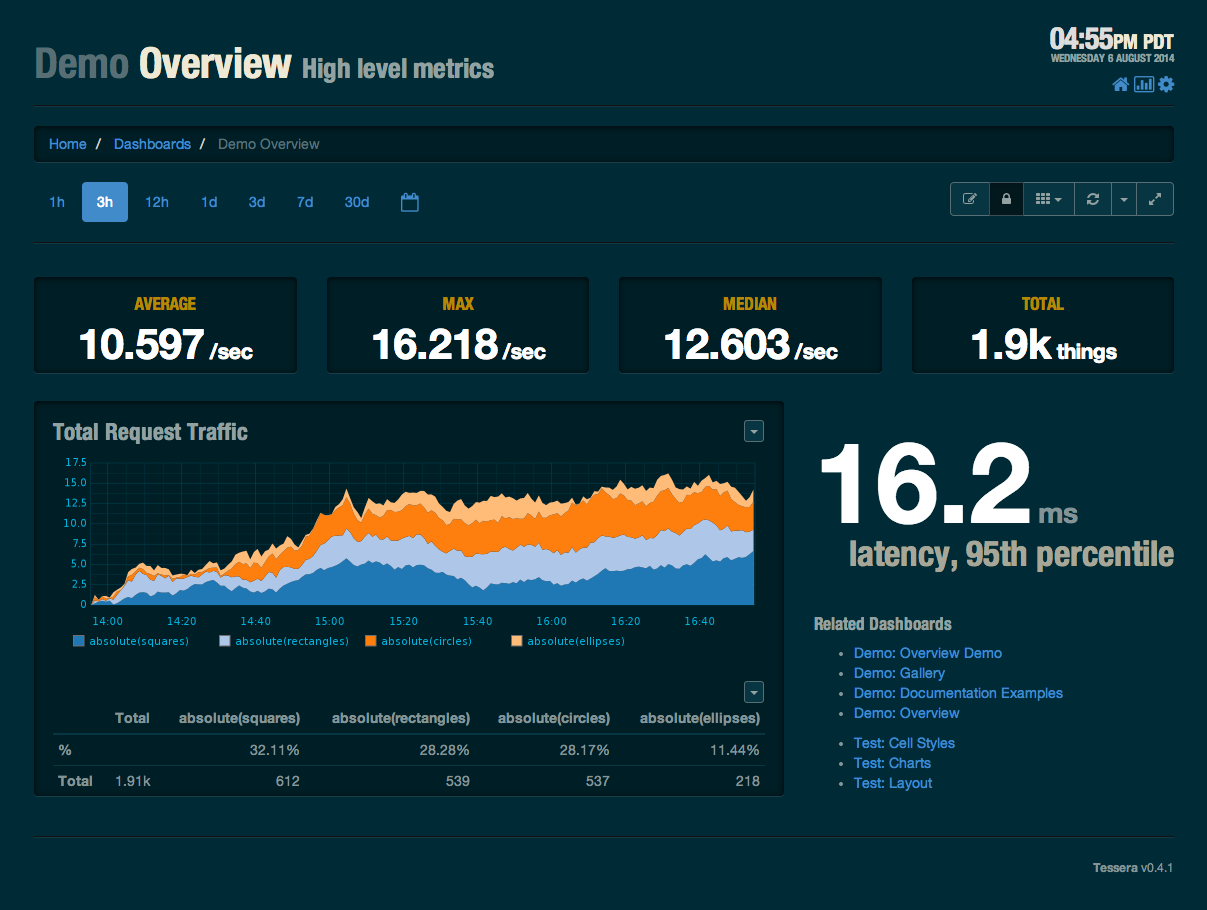
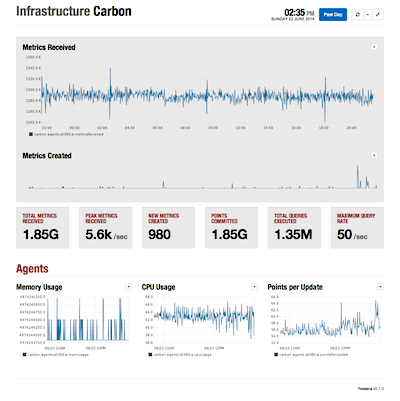
View standard Graphite static PNG charts, or interactive charts rendered by flot.
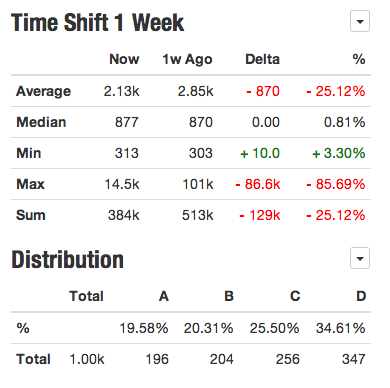
Data from Graphite can be presented in a wide variety of
textual formats — not just
graphs. summation_table, timeshift_summation_table, percentage_table, singlestat,
and jumbotron_singlestat all provides additional
ways to present meaningful analyses of your metrics data.
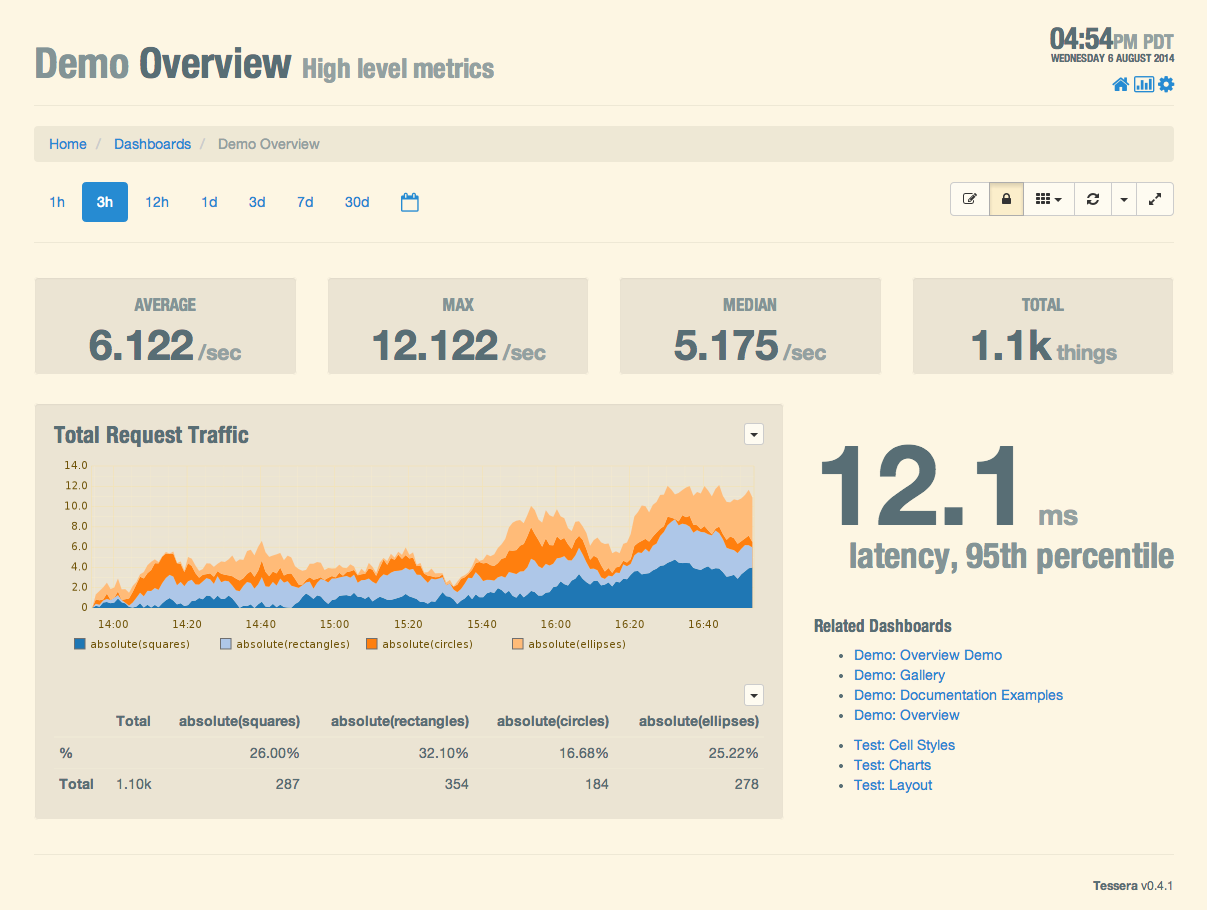
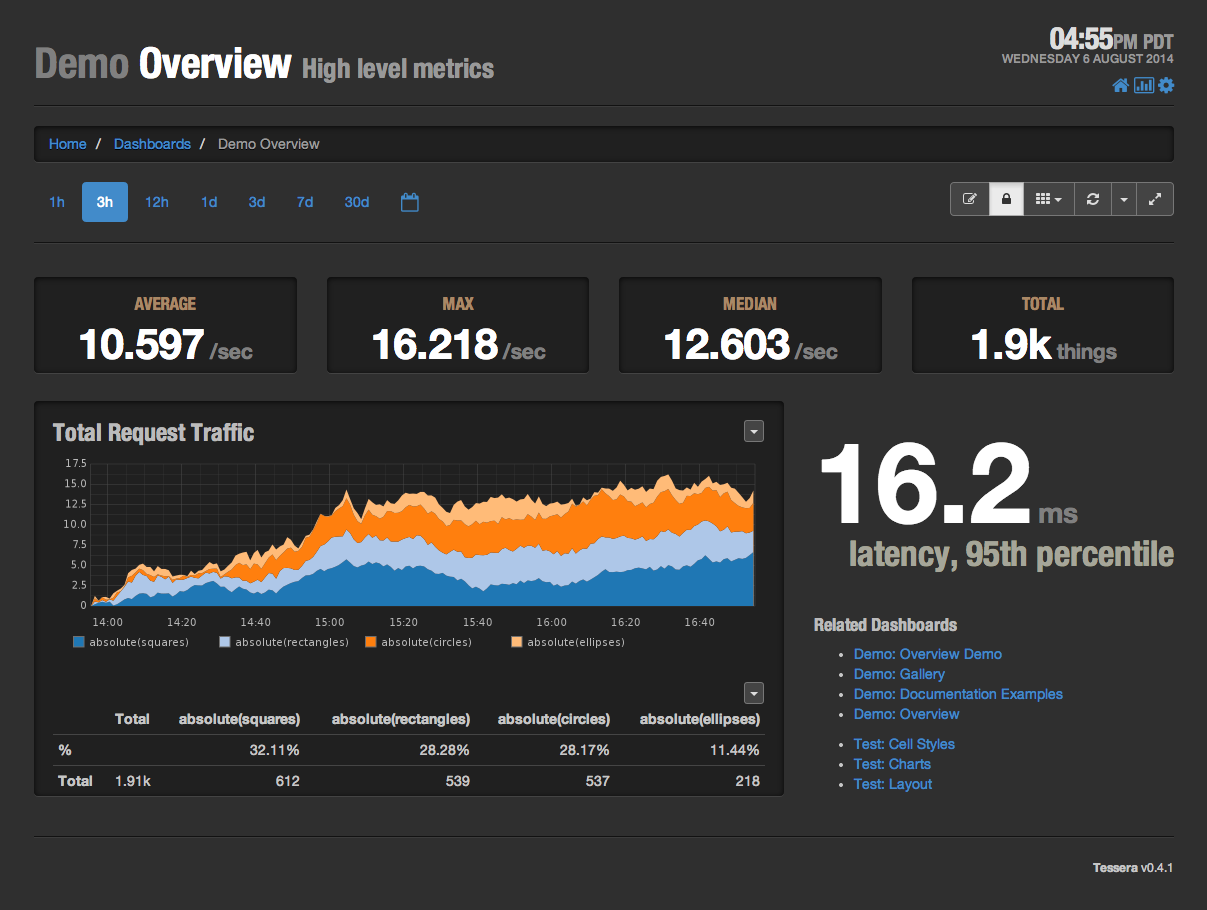
Tessera includes 5 color themes out of the box — three light and two dark — including themes based on the popular Solarized color palette.